
India Market Outlook 2025
- Nov 14, 2025
- 24 min read
Updated: Nov 18, 2025

Section 1 - Executive Summary & Sector Overview
1.1 India’s Hotel Sector: From Recovery to Reinvention
Post Covid India has moved beyond recovery, setting new performance benchmarks. As of Q1 2025, the country had a pipeline of 690+ projects (~88,000 rooms)—the second-largest in the region, after China (~3,600 projects / ~680,000 rooms), and the largest in Asia Pacific. It's pertinent to note that pipeline figures in India often underestimate the economy/mid-tier projects in smaller towns/cities, as the sector is not fully organised, with rough estimates suggesting the total is at least double the size of the organised pipeline data. This scale underscores India’s rising position in the Asia Pacific growth story.
This expansion reflects structural premiumisation, with luxury and upper-upscale segments driving pricing and occupancy. On the capital side, transactions totalled USD 340m in 2024—higher than its peers in Asia Pacific (US$280m , Japan). While Juniper Hotels’ IPO raised US$211 m / ₹1,800 cr) and Schloss Hotels 2025 listing raised US$409m confirmed robust institutional participation.
Sources: Lodging Econometrics Q1 2025; HVS ANAROCK 2025; JLL 2025; NSE/BSE filings; Reuters 2025
1.2 India’s ADR Inflexion Point: Global Headroom, Local Momentum
India’s hotel market is no longer a volume-first story. With occupancy, rates, and RevPAR now consistently rising across both metro and non-metro segments, the narrative is shifting — and fast. FY2024–25 closed with occupancy at 68.5%, ADR crossing US$100 (₹8,525, +5.8% YoY), and RevPAR reaching US$70 (₹5,845, +7.6% YoY). These are strong domestic signals, but also mark a turning point for how India is positioned globally. In premium leisure destinations like Udaipur (US$188) and Goa (US$120), and corporate metros like Delhi and Mumbai (US$115–125), India is already operating at global benchmarks.
Yet at a national level, India still trails mature tourism economies. ADR remains below Singapore (US$ 165), Dubai (US$180), and the European Union & the United States average between US$130- 150 — indicating clear headroom for rate convergence.
Looking ahead, FY2025–26 projections point to further strengthening: occupancy approaching 70%, and ADR growth of 5–6%, led by urban corporate hubs and high-yield leisure corridors. At the same time, Tier-2 and Tier 3 cities are expected to deliver significant upside — driven by wedding demand, wellness travel, national highway expansion, and spiritual/pilgrimage circuits with long-stay potential.

India’s ADR trajectory is no longer speculative. With 8–10% RevPAR growth expected through FY2026, expanding luxury and upper-upscale segments, and robust domestic demand across business and leisure categories, India is becoming one of the world’s most investable rate stories. The global market has long underestimated India’s pricing power. That’s changing — one metro, one destination, one spiritual circuit at a time.
Sources: STR/CoStar Global Hotel Review 2025; HVS ANAROCK Outlook 2025; Hotelivate India Trends 2024; Singapore Tourism Board 2024; Dubai Tourism Statistics 2024; U.S. Lodging Report – CBRE 2025; JLL Hotels & Hospitality Global Update 2024; Ministry of Tourism 2024–25; Press Information Bureau 2025
1.3 Top-End Dominance: Rates Lead the Recovery
India’s rate cycle is firmly premium-led. In CY2024, Udaipur posted the highest ADR at USD 188 (₹15,946), now on par with Bali (US$190) and approaching Southern Europe’s leisure resorts (US$200–220). Goa followed at US$115-120, maintaining positive RevPAR despite demand fluctuations.

Through Q2 2025, RevPAR rose 12.9% YoY. Bengaluru led with +29.4% YoY growth, driven by corporate travel and high-yield events. This places India ahead of Europe (5–6% RevPAR growth) and the United States (4%), confirming that luxury and upscale assets are sustaining both rates and profitability
Sources: Horwath HTL 2024; JLL Q2 2025.
1.4 Pipeline Strength—With Execution Watchpoints
Scale is assured: 693 projects are in development nationwide (Q1 2025). Yet the real challenge lies in execution and securing the right talent. Globally, this is not unique—the United States, with a ~200,000-room pipeline, faces similar talent shortages—but in India, the risks are sharper outside metros.
A post-COVID spurt saw, 64% of signings by keys in 2022, come from brownfield (36.5%) and conversions (27.7%), underscoring a tilt toward capital-efficient, asset-light growth. The differentiator will be how fast and effectively assets move from pipeline to operating reality. The trend of brown field conversions continues, especially in Tier 2/3 cities; however, the last few quarters have shown a noticeable increase in green field projects across the segments, pan India.
Sources: Lodging Econometrics Q1 2025; HVS ANAROCK 2022.
1.5 Demand Engine: Infrastructure, Aviation & Spiritual Circuits
Growth is being powered by aviation and highways. Operational airports doubled from 79 in 2014 to 157 in 2024, with a target of 350–400 by 2047. FY2025 saw 165.4 million domestic flyers—nearly equal to Ryanair’s 181 million passengers in Europe. Between January and July 2025 alone, 97.8 million travelled (+5.9% YoY), underscoring the sustained momentum of India’s aviation recovery. At the same time, highway expansion—23,800 km added since 2017, making India the world’s second-largest network—has reduced travel times across key corridors, boosting regional connectivity unlocking new tourism and hospitality demand.
Over the past decade, various highway expansion schemes like Bharatmala and Gati Shakti are unlocking drive-to leisure and spiritual hubs. New nodes scale fast: Ayodhya Airport hit 1.1 million passengers in its first year, Goa Mopa 4.6 million, while Delhi T3 is adding 50% international capacity by the end of 2025. Together, these build a multi nodal ecosystem, fuelling distributed MICE, leisure, and pilgrimage flows.
Sources: MoCA/PIB 2047 Vision; ICRA 2025; DGCA Jan–Jul 2025; AAI 2024–25; ToI 2025; MoRTH 2024–25.
1.6 Capital Flows & Investor Confidence
Investor appetite remains strong. 2024 saw US$340m (₹2,890 cr) in transactions, placing India ahead of peers in Asia Pacific. Schloss Hotels’ IPO (US$211m / ₹1,800 cr) was oversubscribed 6.2x in Aug 2025. Juniper Hotels IPO listing in February 2024 marked the arrival of yield vehicles in Indian hospitality.
While hotel stocks corrected 14% mid-2025, this reflected global volatility—similar corrections hit United States REITs—rather than domestic weakness. Medium-term flows are turning institutional, decentralised, and Tier-2/3-focused, aligning with domestic tourism demand.
Sources: JLL 2025; NSE/BSE 2024; Reuters 2025; ET; Moneycontrol 2025.

1.7 India’s Tourism Story: Scale, Soul, and Structural Momentum
India’s tourism sector has moved decisively beyond recovery and into reinvention. At the heart of this transformation is a model unlike any other in Asia — driven by deep domestic demand, a rising middle class, and culturally anchored, purpose-led travel, all backed by a generational leap in connectivity.
In 2024, India recorded nearly 3 billion domestic trips, placing it among the largest internal travel markets globally. This is structural, not cyclical — supporting hotel performance, aviation growth, and Tier-2/3 expansion. At the same time, foreign tourist arrivals (FTAs) reached 9.95 million, up 54% over two years, boosted by e-Visa reforms, air connectivity, and rising global interest in India’s differentiated offering.
Performance metrics confirm momentum: RevPAR is projected to grow 8–10% in FY2025 and 7–8% in FY2026, outpacing Europe (5–6%) and the United States (4%). While India’s absolute RevPAR (US$70) still trails mature markets (Europe US$100+, United States US$95), the upside is clear — particularly in Tier-2/3 cities, where infrastructure, weddings, spiritual tourism, and wellness are expanding demand.
Events like the Maha Kumbh 2025 are now economic engines; such a single mega event alone is expected to generate around US$25–30 bn( ₹2 2.5 lakh crore ). Uttar Pradesh’s tourism economy alone is projected to exceed US$45 bn, ( ₹4 lakh crore ), led by Ayodhya, Varanasi, and related spiritual & Heritage circuits, across the country.
Segment-wise, luxury and upper-upscale hotels are leading rate recovery, with ADRs up 20% YoY (2023–24). India’s US$3.6 bn luxury hospitality market (2025) is forecast to grow to USD 6.3 bn by 2030 (11.5% CAGR). Meanwhile, midscale and economy hotels remain essential volume drivers — especially for corporate and first-time travellers.
Enabling this growth is a decade of infrastructure gains. India has more than doubled its airports (from 74 in 2014 to 159 in 2024), while national highways and regional air links are connecting spiritual and heritage circuits with mainstream demand.
Yet India’s edge is not just scale — it’s soul. Travellers today want immersion over itineraries. Spiritual corridors like Rishikesh and Bodh Gaya, festivals like Diwali, Durga Puja and Holi, and cities like Varanasi — which saw a +76% YoY surge in search traffic — are becoming primary motivators. 82% of Indian travellers now cite culture as central to their trip planning — a demand pattern few global markets can match.
India is no longer catching up. It’s creating its own category. With purpose-driven travel, rising affluence, and infrastructure that both supports and stimulates demand, India is fast becoming a global long-cycle opportunity — where scale meets soul, and volume meets value.
Sources: Ministry of Tourism 2024; Press Information Bureau 2024–25; Hotelivate 2024; HVS ANAROCK Outlook 2025; Mordor Intelligence 2025; CareEdge 2025; Kotak Institutional Equities 2025; Business Standard 2025; STR/CoStar 2025; SBI Research 2024

Section 2 - India’s Tourism Story: Scale, Resilience & Global Trajectory
2.1 India’s Tourism Scale & Structural Depth
India’s travel and tourism sector contributed US$250.2 billion to GDP in 2024, ranking 8th globally and 4th in Asia Pacific. The industry is projected to grow at a CAGR of over 9.3%, more than doubling to US$550–600 billion within the next 5–7 years, positioning it among the fastest-growing tourism markets worldwide. With over 3 billion domestic trips annually, India is already one of the world’s largest internal travel markets, comparable to the United States and China. Notably, domestic demand—accounting for 85–90% of hotel stays—helps stabilize business cycles, insulates the sector from currency and geopolitical volatility, and delivers risk-adjusted returns stronger than most Asia Pacific peers.
Asia Pacific Comparison: Travel, Tourism & Hospitality (2014)

Sources: WTTC, National Tourism Boards, 2024 estimates
While GDP contribution provides the most consistent global benchmark, India’s full tourism economy in 2024 generatedUS$245b in revenue, includingUS$180b from domestic travel andUS$36b from international visitors. This scale underscores India’sdomestic-led resilience, in sharp contrast to mature Asia Pacific peers like Japan and South Korea, where growth is plateauing due to demographics and saturation.
2.2 Connectivity & Infrastructure as Demand Multipliers
Aviation and infrastructure are powering hotel demand. India handled 165m+ domestic flyers in FY2025, making it the world’s 3rd-largest domestic aviation market.
Ayodhya Airport: 1.1M passengers in year one — rare for pilgrimage markets.
Goa Mopa: 4.6M passengers in 2024, rivalling SE Asia leisure hubs.
Delhi IGI T3 expansion (2025): +50% international capacity, placing Delhi among global mega-hubs.
Government spending of US$37B (₹3.1T) in 2024 on airports, expressways, and multimodal hubs is dispersing demand beyond metros. Unlike Asia’s metro-heavy rebounds, India’s growth is multi-nodal, multi-segment — spanning leisure, weddings, MICE, wellness, and Tier-2 corporate travel.
Sources: DGCA/ICRA – Aviation Outlook FY2025; Airports Authority of India 2024–25; Ministry of Civil Aviation/PIB – Airport Vision 2047
2.3 Tier-2/3 Markets & Long-Cycle Upside
The next wave of growth is outside metros. 13,000 rooms signed in FY24–25 in Tier-2/3 cities such as Ranchi, Ayodhya, and Guwahati. Purpose-led travel — pilgrimage, medical, wellness, weekend leisure — is creating institutional-grade hotel markets.
Pilgrimage hubs already achieve 70–75% occupancy and ADRs of US$72–82, comparable to Lourdes and Santiago de Compostela.
The sector employed 46.5M people in 2024 (9.1% of workforce), projected to 64m by 2035. Tourism GDP is set to double to US$550-600b by 2035, with a long-run horizon of US$3T by 2047.

For global stakeholders, India is a rare dual-market thesis: the domestic stability of the US/China with the growth trajectory of emerging Asia. India is not catching up — it is creating a new category in global hospitality, where volume and value converge.
Sources: HVS ANAROCK – Hotel Development 2023–24; STR – Demand Segments 2024; WTTC – Economic Impact 2024; Ministry of Tourism 2024; IBEF 2024
Section 3 - India’s Hospitality Story: Converge with Global Leaders
3.1 The convergence Dynamics
India’s hotel sector has entered a late-upcycle, rate-led phase, with FY2023/24 occupancy at 67.5%, ADR at US$95 (₹8,055), and RevPAR at US$64 (₹5,440) — a nearly 20% YoY uplift. Gains are price-driven rather than volume-led, market maturity and sustained rate discipline. Luxury ADRs in Udaipur (US$188/₹15,946) and Goa (US$128/₹10,900) now rival Bali (US$125) and parts of Southern Europe (US$150+), while metros such as Mumbai and Delhi sustain ADRs above US$120 into 2025. Midscale and upscale brands are expanding into Tier-2 markets on the back of weddings, pilgrimage, and corporate flows — proving that pricing power is structural, not cyclical.
Placed globally, India is converging with Europe while outpacing much of Asia Pacific. Germany and the United Kingdom report occupancies above 70% but slowing ADR momentum; Japan and South Korea ride inbound surges yet remain exposed to volatility. India, by contrast, offers European-level occupancy stability with Asia Pacific leading ADR growth. Its RevPAR of US$64 still trails Singapore (US$122) and Dubai (US$137), but the gap highlights headroom for growth, especially given India’s scale and domestic resilience.
India also commands the largest hotel pipeline in Asia Pacific outside China, with 693 projects, ~88,900 rooms (Q1 2025), two-thirds of them brownfield or conversions, reflecting capital efficiency. Execution risks remain — clustered metro supply, Tier-2 regulatory delays, and talent gaps — yet aviation-driven demand provides a powerful counterweight. FY2025 logged 165m domestic flyers, supported by 159 operational airports with expansion to 350–400 by 2047. New nodes such as Ayodhya (1.1m passengers in year one) and Mopa, Goa (4.6m in 2024) are dispersing demand, while Delhi’s T3 expansion will lift international capacity by 50% in late 2025..
Capital flows mirror this resilience. Hotel transactions in 2024 reached US$340m (₹28,900 crore), while landmark listings — Juniper’s US$211m IPO and Schloss’s US$409m debut — underline institutional confidence. Tier-1 assets are benefiting from compressed cap rates, while Tier-2 investments require strong brand alignment and proven execution. Taken together, India is no longer a peripheral growth story but a global convergence market — resilient, diversified, and institutionally investable. In the decade ahead, those who deliver timely, brand-aligned supply will define the winners, positioning India as Asia Pacific’s most compelling hospitality opportunity and a credible global leader-in-the-making.
Exhibit 3.A — India in Global Context: KPIs, Pipeline & Capital.

3.2 India’s Performance Story
India’s hotel sector has shifted into a rate-led cycle, with RevPAR gains driven by pricing integrity, not volume recovery. CY2024 closed with ADR US$95, RevPAR US$60, proving India can sustain topline growth without relying on occupancy spikes.
Globally, India’s occupancy is approaching European benchmarks (Germany 70%, United Kingdom 71%), while its ADR trajectory is outpacing Asia Pacific peers. Luxury ADRs in Udaipur (US$188) and Goa (US$128) now rival Bali (US$125) and Southern Europe (US$150+). Midscale expansion across Tier-2 cities demonstrates that breadth of demand is widening beyond metros.
The pipeline of 693 projects cements India’s Asia Pacific leadership, but execution is the next test: timely supply, talent, and market-fit will determine outcomes. At the same time, aviation-led growth is dispersing demand across new nodes, ensuring India’s expansion is not metro-centric but multi-nodal. India is now a core allocation market: resilient, diversified, and institutionally investable. In the decade ahead, execution—not demand—will define winners, positioning India as Asia Pacific’s most attractive hospitality opportunity and a credible global leader-in-the-making.
Sources: Horwath HTL – India Hotel Market Review 2024; HVS ANAROCK – Outlook 2025; JLL – Hotel Momentum India Q2 2025; STR/CoStar – Global Market Updates 2024; Hotelivate – Comparative Benchmarking 2024; Lodging Econometrics – Asia Pacific Construction Pipeline Q1 2025; DGCA/ICRA – Aviation Updates 2024–25; Ministry of Civil Aviation/PIB – Airport Vision 2047; AAI – Passenger Throughput 2024–25; NSE/BSE filings; Reuters – Schloss IPO 2025
Section 4 - India’s Development: Converge with Global Leaders
4.1 Tier-1 Metros: Anchors of Cashflow and Rate Discipline
India’s six Tier-1 metros — Delhi NCR, Mumbai, Bengaluru, Hyderabad, Chennai, and Kolkata — remain the financial backbone of the hotel sector.
CY2024 performance highlights:
Occupancy: 66–72% (comparable to Germany at 70% and the United Kingdom at 71%)
ADR: Mumbai (US$124), Delhi (US$100–102), converging with Shanghai (US$105) and Bangkok (US$115), though below Singapore (US$165) and Tokyo (US$140)
RevPAR: Mumbai US$89, Delhi US$71 — closing the gap with global metro benchmarks
Metros capture multi-dimensional demand: corporate, MICE, weddings, F&B, and heritage-linked leisure. Delhi NCR leverages UNESCO icons (Red Fort, Qutub Minar, Humayun’s Tomb), while Hyderabad’s Charminar and Golconda Fort reinforce its corporate + cultural duality.Metros provideEuropean-style stability (United Kingdom /Germany)and Asia Pacific-style growth momentum (Shanghai, Bangkok, Tokyo, Singapore), making them India’scashflow anchors and pricing benchmarks.
Exhibit 4.A — Metro Performance Snapshot: India vs Global (CY2024)

4.2 Beyond the Metros: Heritage, Leisure, Wellness & Pilgrimage
India’s long-cycle growth lies in Tier-2/3 markets, where cultural soul, leisure demand, and purpose-driven travel converge. With 44 UNESCO World Heritage Sites — the highest in Asia Pacific and second globally to China — India offers globally recognized depth comparable to Italy, Spain, and France.

Heritage Icons:
• Taj Mahal (Agra): Occupancies 70%, ADR US$100–120, comparable to Paris (Eiffel Tower hotels, ADR US$150).
• Red Fort & Qutub Minar (Delhi): Reinforce Delhi’s blended business–leisure demand.
• Charminar & Golconda Fort (Hyderabad): Dual demand pull for tech + heritage.
• Khajuraho, Ajanta–Ellora, Hampi: Comparable to Angkor Wat (Cambodia), Petra (Jordan).
Leisure & Weddings:
• Jaipur: ADR US$105–110, 70% occ.; peers: Kyoto (US$110), Florence (US$150).
• Udaipur & Jodhpur: Luxury ADRs US$180–200; peers: Amalfi Coast, Santorini US$200+.
• Goa: ADR US$115–120, occ. mid-60s; peers: Bali US$125, Phuket US$120.
Wellness & Himalayas:
• Rishikesh–Dehradun: ADR US$94–97, occ. 65%; peers: Ubud US$105, Chiang Mai US$100. • Shimla–Manali: ADRs US$98–103; peers: Chiang Mai (US$100). Pilgrimage & Spiritual
Circuits:
• Ayodhya: Occ. 70–75%, ADR US$72–76.
• Varanasi: Occ. 70%, ADR US$78–82.
• Peers: Lourdes (France, US$80), Santiago (Spain, US$90).
Medical MICE:
• Chennai, Delhi, Hyderabad: Global medical + MICE hubs; peers: Tokyo (medical conferences), Houston (medical MICE).
Exhibit 4.B — Diversified Tier-2/3 Markets vs Global Peers (CY2024)

4.3 Strategic Framing: India’s Dual Engine
India’s hotel economy operates on a dual-speed model:
• Tier-1 Metros: Offer European-style stability (United Kingdom, Germany) and Asia Pacific convergence (Singapore, Shanghai, Tokyo, Bangkok).
• Tier-2/3 & Specialized Nodes: Deliver Southern Europe heritage premiums (Florence, Amalfi), Southeast Asia leisure/wellness depth (Bali, Phuket, Ubud, Chiang Mai), and unique medical + pilgrimage resilience.
Investor Takeaway: India blends stability, cultural premiums, and multi-segment demand — enabling portfolio diversification within one market.
4.4Section Summary: Two-Speed Growth with Diversified Demand Engines
India’s hospitality is now dual-speed, diversified, and globally resonant:
• Metros: Anchor cashflow stability and rate discipline, benchmarked against the United Kingdom, Germany, Singapore, Shanghai, Tokyo, Bangkok, Dubai.
• Tier-2/3 Hubs: Unlock growth through heritage depth, leisure premiums, wellness retreats, pilgrimage resilience, and medical MICE — with 44 UNESCO World Heritage Sites (highest in Asia Pacific, second only to China) as global recognition.
This positions India as a global category creator: combining European heritage durability, Asia Pacific leisure/wellness growth, and uniquely Indian pilgrimage + medical circuits. India is the only Asia Pacific market where investors can accessmetro stability + diversified demand upside (heritage, leisure, wellness, pilgrimage, medical MICE) in one portfolio — making it a globally compelling long-cycle opportunity.
Sources: STR/CoStar – Global & India Market Updates 2024; HVS ANAROCK – India Hospitality Outlook 2025; Hotelivate – City & Heritage Performance Review 2024; Horwath HTL – India Market Review 2024; UNESCO World Heritage Centre 2024; UNWTO – Tourism Highlights 2024; WTTC – Wellness & Medical Tourism Outlook 2024
Section 5 - Pricing Power & Revenue Strategy: India’s Differentiator
5.1 ADR-Led Growth: Structural, Not Cyclical
India has entered a rate-led cycle rare in Asia Pacific. CY2024 closed with a national ADR of about US$100 (₹7,951), up 10.7% YoY and 18% above 2019 levels. UnlikeJapan or South Korea, where RevPAR gains rely on inbound surges, India’s strength lies in structural domestic demand — weddings, wellness, pilgrimage, corporate, and leisure.
This places India closer toSouthern Europe (Spain, Italy), where RevPAR growth is sustained by lifestyle and leisure travel. Yet India’sdomestic driven cushion (85–90% of demand)makes it even more resilient against foreign exchange swings or outbound shocks.
5.2 Luxury & Leisure: Rate Leadership with Global Parity
Luxury and upper-upscale destinations are leading the rate transformation:
• Udaipur ADR US$188 (₹15,946)→ matchesBali (US$190)and is closing in onSouthern Europe resorts (US$200–220).
• Goa ADR US$115–120 (₹9,800–10,300)→ on par withPhuket (US$120), supported by dual airport access.
• Jaipur ADR US$105–110 (₹8,900–9,350) → mirrors Kyoto (US$110) and Florence (US$150)in heritage-driven event demand.
• Delhi & Mumbai ADR US$118–129 (₹10,000 11,000)→ comparable withBangkok (US$115), but with30%+ revenues from F&B, a mix few Asia Pacific peers achieve.
This shows India’spricing convergence with global benchmarks, underpinned not by inbound tourism but by domestic affluence and purpose-driven travel.
5.3 Midscale Resilience & Ancillary Revenue Expansion
India’s rate resilience extends beyond luxury:
• Midscale ADRs are approaching US$105 (₹9,000) in hubs like Kochi, Goa, and Tier-2 corporates.
• Event compression (weddings, MICE, pilgrimage) is structural: ADRs rise +15–25% during peaks, compared with10–12% in Europe.
• Ancillary revenues are decisive:
Weddings & events: 30–35% of toplinein NCR, Rajasthan, Goa.
Wellness & medical: 10–15% of revenuesin Rishikesh, Kochi, Chennai.
This diversified revenue model contrasts with many global peers where room sales dominate. For investors, it signals margin resilience even in midscale segments.
5.4 Policy Backdrop: GST and Rate Strategy
Tax policy now shapes pricing almost as much as demand. The 2025 GST regime retained the 5% slab (no Input Tax Credit) for rooms <₹7,500 / US$88. This has:

• Pushed operators to engineer base rates just below the slab.
• Driven value-shifting into F&B, wellness, and packages.
Industry lobbying for a higher slab (₹10,000 / US$118)would ease midscale compression, align effective ADR with market trends, and unlock further growth.
For global investors, this is awatchpoint: while demand is secure, policy distortions can temporarily reshape yield management.
5.5 Section Summary: Pricing as India’s Edge
India has become one of the few global markets where pricing is the growth engine. Luxury hubs now command ADRs on par with Bali, Phuket, Kyoto, Florence, while midscale segments strengthen through compression and ancillary revenues. Weddings, wellness, and MICE are no longer seasonal boosts — they are structural pillars of profitability.
Compared globally, India combines:
• Southern Europe’s yield resilience,
• Asia Pacific’s scale of demand, and
• Unique domestic ballast.
For stakeholders, the signal is clear: pricing discipline will define profitability in India. The topline trajectory (RevPAR CAGR 8–10% through 2026) positions India not only as Asia Pacific’s best pricing story but as a credible global leader in structural rate power.
Sources: HVS ANAROCK – Outlook 2025; STR/CoStar – Global & India Market Updates 2024; Hotelivate – City Performance Review 2024; Horwath HTL – India Hotel Market Review 2024; JLL – Hotel Momentum India 2025; Economic Times 2025; FHRAI 2025
Section 6 - Costs, Margins & Profitability: Balancing Yield and Execution
6.1 India’s Profitability Story: Strong Toplines, Complex Margins
India’s hotel sector is now generating record toplines, but converting revenues into sustainable bottom lines is more complex. In CY2024, nationwide NOI margins averaged 28–32%, ahead of China (25–28%) and South Korea (22–26%), though still shy of European leisure markets such as France and Italy (32–35%).
This contrast highlights India’s duality: more profitable than Asia Pacific peers, but not yet at European efficiency. The opportunity is clear — if India controls costs and strengthens tax alignment, it could become the first Asia Pacific market to match Europe’s margin stability.
6.2 Labour and Utilities: The Cost Pressures
Two factors are defining India’s margin squeeze:
• Labour: Wage inflation rose 6–8% in 2024, especially in Tier-1 metros where demand for skilled F&B and housekeeping staff exceeded supply. Weddings and MICE activity further stretched staffing, while productivity gains plateaued.
• Utilities: Energy and water tariffs added 2–3 percentage points to operating costs, with full-service hotels in Delhi Aerocity and Bengaluru Whitefield most exposed.

The net effect: NOI conversion is under pressure, even in hotels with strong RevPAR growth — a challenge not unlike Europe in the early 2010s, where labour costs reshaped profitability curves.
6.3 Segment-Wise Margin Reality
Margins diverge sharply by segment:
Exhibit 6.A – Segmental NOI Margins (CY2024)

Luxury assets retain resilience, while midscale and economy struggle structurally. A similar divergence was seen in Japan post-2015, when tax and wage inflation compressed mid-market performance.
6.4 GST and Regulatory Pressures
The 2025 GST regime retained the 5% slab for rooms below ₹7,500 (US$88), without input tax credit (ITC). While boosting affordability, this structure erodes NOI margins by blocking credit on F&B and services — often 30–40% of full-service revenues.
Luxury properties, which operate above the slab, continue to benefit from input tax credit (ITC), giving them a structural profitability edge. India is unique in this regard — most global peers (e.g., Europe, Japan) have tax structures that align better with operational realities.
6.5 Capital Structures and Investment Yields
Despite operational headwinds, India remains a yield premium market for investors:
Exhibit 6.B – India vs Global Investment Metrics (2024–25)

By global standards, India’s IRRs are 2–3x higher than those mature markets of Asia Pacific, United States or Europe, but the flip side is execution risk and regulatory friction.
6.6 Strategic Takeaways
• Owners: Profitability hinges on labour productivity, energy procurement, and pre-opening planning. In Tier 2/3 markets, banquets, wellness, and F&B optimisation must carry NOI resilience.
• Operators: Defend RevPAR gains through channel mix, loyalty ecosystems, and segmented BARs. In oversupplied micro-markets, yield protection matters more than occupancy chasing.
• Investors: India remains a yield premium market, but underwriting must factor GST compression, wage inflation, and execution delays. Brownfield conversions and franchise-light models outperform greenfield projects.
6.7 Section Summary: Profitability as the New Battleground
India’s hotels are delivering higher NOI margins than Asia Pacific peers but face sharper cost and tax challenges than Europe. Luxury assets remain shielded by diversified revenues, while midscale and economy segments are structurally constrained.

The investor lens is clear: India offers returns unmatched globally, yet profitability is now the true battleground. Success will depend less on topline growth and more on managing costs, navigating regulation, and deploying capital efficiently.
As India enters its next growth phase, the question is no longer whether demand exists, but whether revenues can consistently translate into sustainable bottom lines.
Sources: HVS ANAROCK – Outlook 2025; Hotelivate – T&O Review 2024; Horwath HTL – India Market Review 2024; STR/CoStar – Global Market Benchmarks 2024; OECD 2024; FHRAI/Economic Times 2025.
Section 7 - Real Estate & Capital Markets: From Yield to Institutionalisation
7.1 A Maturing Market — Still Yield-Driven
India’s hotel capital landscape is evolving into a maturing, institutionalising market, where yields remain a core attraction. In 2024, hotel transactions totalled US$340 million (₹2890 crore) across 25 deals, with Tier-2/3 cities contributing nearly half—a sign that capital is following India’s multi-nodal demand base.
Momentum continued into H1 2025, with deal volumes reaching US$167 million (₹1420 crore), almost double H1 2024 (US$93 million). Family offices and high-net-worth individuals accounted for 54% of volumes, up from 51% in 2024, underscoring the decentralization of capital and growing conviction of domestic investors in hospitality.
Despite transactional volumes going up steadily, India’s transaction volumes remain modest by global comparison, however, its yield advantage continues to attract capital to the sector, and there has been a marked uptick in transactions in the past couple of years.

7.2 Market Evolution: From Family Capital to Platforms
Two landmark IPOs — Juniper Hotels IPO (US$218m / ₹1,800 crore, Feb 2024) and Schloss Hotels (US$409m / ₹3,500 crore, May 2025) — have signalled a structural pivot from family-office dominance to platform-led participation. While deal flow is still family/high-net-worth individual heavy, these listings set the stage for India’s first hospitality REIT within 3–5 years, mirroring Singapore’s and Japan’s transition from private ownership to institutional platforms.
7.3 Investment Structures and Yield Profile
India remains a yield-premium market compared to global peers.
Exhibit 7.A – Investment Benchmark: India vs Global IRRs (CY2024)

Deal structures in India (2024):
• Management contracts dominate (81%), especially in Tier-1 metros.
• Franchise models (14%) are rising in Tier-2/3 and midscale.
• Leases remain rare, constrained by regulation and cultural ownership bias.
7.4 Deal Composition: 2024 vs 2025
India’s deal flow is diversifying, with Tier-2/3 markets gaining traction and family capital maintaining dominance.
Exhibit 7.B – India Hotel Transactions by Investor Type

Compared globally, India’s investor mix is unusual: family/high-net-worth investors dominate, while in Europe or Japan, REITs and institutions drive the bulk of deal-making. This decentralisation makes India higher-yield, but also more execution-sensitive.
7.5 Lending and Cost of Capital
India’s financing remains bank-led and brand-biased:
• Branded assets refinance at 8–11% IRR-equivalent, while independents face higher spreads.
• DSCR requirements are tightening (1.3–1.5× minimum) in Tier-1 micro-markets like Delhi Aerocity.
• Tier-2/3 funding hinges on brand tie-ups and corridor viability.
By comparison, Japan (2–3%) and Europe (3–4%) enjoy ultra-low borrowing costs, supported by REIT ecosystems. India’s high cost of capital reflects macro rates, but also offers a yield premium for investors willing to underwrite operating risk.
Exhibit 7.C – India vs Global Cost of Capital (CY2024)

7.6 Strategic Implications
• Owners: Platform-building is now essential. Heritage repositioning, MICE hubs, and corridor-linked nodes (Ayodhya, Kochi) attract valuation premiums. Exit strategies must align with IPO/REIT pathways.
• Operators: The rise of franchise and platform-led models increases accountability. IPO-backed players face public market scrutiny on performance delivery.
• Investors: India is shifting from a yield-only story to a platform-plus-yield play. Metros offer liquidity, but Tier-2/3 hubs deliver asymmetric upside through pilgrimage and leisure demand.
7.7 Section Summary: From Yield to Institutionalisation
India’s hotel capital markets are transitioning from fragmented, owner-led deals to structured, institutional flows. Transactions are broadening, IPOs have unlocked public market participation, and REITs are within sight.
For global stakeholders, India remains a high-yield, high-discipline market: IRRs of 10–15% vs 4–6% in Europe and 6–8% in Japan. Yet success will depend on execution, absorption, and regulatory clarity.

Metros will continue to anchor liquidity, but the next leg of growth lies in Tier-2/3 markets, where infrastructure and pilgrimage-driven demand are creating structural investment opportunities.
Sources: JLL – India Hotels Investment Highlights 2024; CBRE – Hospitality Market Watch 2024; Economic Times 2024–25; HospitalityBizIndia 2025; STR/CoStar – Global Market Updates 2024; UNWTO – Tourism Finance Review 2024
Section 8 - Policy Tailwinds and Risk Headwinds: India’s Double-Edged Growth Cycle
8.1 Opening Frame: Policy as Floor, Risks as Ceiling
India’s hotel sector is expanding at record speed — but unlike Europe, where rail networks drove urban clusters, or China, where high-speed rail unlocked Tier-2 megacities, India’s trajectory is aviation + roads + policy anchored. New airports, highway corridors, pilgrimage circuits, and wellness-medical travel have made government the most decisive shaper of hospitality demand in India’s modern history.
Policy has become the demand floor, converting spiritual, medical, and leisure corridors into investable hotel markets. Yet risks are equally visible: clustered supply, input inflation, regulatory friction, and climate fragility form the execution ceiling.
For global investors and operators, India offers both structural resilience and margin vulnerability — a duality that must be navigated with discipline.
8.2 Policy as a Structural Demand Engine
Government initiatives are no longer enablers; they are market-makers.
• Central Schemes: Swadesh Darshan 2.0 and PRASHAD are transforming Ayodhya, Varanasi, Haridwar, and Puri into structured hospitality hubs. Ayush Visa and Heal in India are embedding wellness and medical travel into mainstream tourism, boosting nodes like Kerala (Ayurveda), Rishikesh (yoga + retreats), Chennai/Chandigarh (medical hubs), and NCR (super-specialty care).
• Aviation & Roads as Backbones: With 157 airports (2024) targeting 350–400 by 2047, aviation is India’s defining growth lever. Highways and expressways — Delhi–Lucknow, Delhi–Dehradun, Bengaluru–Mysuru — are doing for short-getaway and leisure circuits what aviation is doing for Tier-2/3 cities. Where Europe’s growth was rail-driven and China’s high-speed-led, India’s is aviation + highways-led, knitting pilgrimage, hills, and secondaries into investable hotel nodes.
• GST 2025:The 5% slab ≤₹7,500/night keeps affordability intact for domestic mass travel, but erodes NOI for full-service hotels. Rate engineering and ancillary packaging remain stopgaps until the slab is lifted to ₹10,000. Input tax credit (ITC), remains a sticky issue with the Industry.
• State Incentives:

Goa: convention centre + MICE infrastructure.
Rajasthan: heritage conversion concessions, fort/palace repositioning.
Kerala: Ayush + medical wellness corridors.
Himachal/Uttarakhand: eco + spiritual + hill station incentives.
Odisha: sports + temple infra.
Global Perspective: Unlike France/Japan’s event-led demand surges (Paris 2024 Olympics, Tokyo 2020), India is building long-cycle destination corridors in pilgrimage, wellness, hills, and short-leisure nodes. For investors, this means visibility is higher and less cyclical — policy is anchoring repeatable demand, not one-off spikes.
Exhibit 8.A – India’s Policy-Driven Demand vs Global Peers (2024–25)
8.3 Risks and Fragilities: Execution, Costs, Climate
India’s ~88,900-room pipeline (Q1 2025) is the largest in Asia Pacific ex-China — but execution fragility mirrors other emerging markets.
• Execution Risks: Project delays in Delhi NCR and Bengaluru, clustered supply in Aerocity, Whitefield, North Goa; luxury/event hotels face talent shortages.
• Policy & Regulatory Risks: GST remains misaligned with upscale ADRs; liquor licensing continues to erode F&B profits; state-level land/heritage approvals inconsistent.
• Operating Margins: Wage inflation (6–8% YoY), utilities (+2–3% of operational expenditure), OTA dependence (200–300 bps off margins) strain profitability even in demand-heavy metros.
• Macro-Financial & Foreign Exchange Risks: Oil price volatility → aviation costs; rupee depreciation → higher OS&E/FF&E costs; global recession → inbound recovery delays.
• Climate & ESG Fragility:
Himalayan leisure hubs (Shimla, Manali, Nainital): carrying capacity limits.
Coastal markets (Goa, Kerala): flooding, erosion, monsoon volatility.
Heritage markets: rising cost of ESG compliance for conversions.
Global Perspective:
• Oversupply risk echoes China’s clustered downturn (2013–16).
• Inflation pressures resemble Europe 2022–24.
• Foreign exchange shocks mirror Brazil/Indonesia during oil cycles.
• Climate limits resemble Maldives or Kyoto.
Exhibit 8.B – India’s Risk Stress-Test vs Global Parallels (2025–27)

8.4 Stakeholders Strategic Implications for
• Owners: Target policy-linked hubs (Ayodhya, Rishikesh, Dehradun, Goa, Kerala) with brownfield/conversion projects; build ESG upgrades into capex.
• Operators: Engineer rates in the ₹7,500 ₹10,000 band; diversify beyond OTAs; position assets around wellness/medical, hill-leisure, and heritage demand.
• Investors: View central/state-linked corridors as demand floors; stress-test models for clustered supply, foreign exchange shocks, and ecological disruption; prioritise branded assets in wellness, heritage, and policy-supported clusters.

8.5 Investor Takeaway: Discipline Over Optimism
India is one of the few global markets where hospitality demand is structurally created by policy — aviation, highways, pilgrimage, wellness, medical, heritage, and leisure circuits. This makes the country’s cycle both broader and more durable than event-led peers in Europe or leisure-heavy peers in Thailand.
Yet the same scale brings global-style risks — oversupply (China), margin squeeze (Europe), foreign exchange shocks (Brazil), ecological fragility (Maldives). For global stakeholders, India offers scale, premiumization, and resilience. But returns will hinge not on demand creation — which is secured by policy — but on execution discipline, ESG compliance, and margin protection.
Sources: Lodging Econometrics – APAC Construction Pipeline Q1 2025; MoT 2024; MoCA 2024; PIB 2024; FHRAI 2025; HVS ANAROCK 2025; Hotelivate 2024; IMF 2025; RBI 2025; UNWTO 2025.
Section 9 - Conclusion: India’s Hospitality Story
9.1 Technology-Driven Personalization and Automation Guest
India is at the forefront of digital commerce, especially in the hotel and tourism industry. Digital penetration and transformation are deeply influencing guest engagement strategies across India's hospitality sector. From AI-enabled booking platforms to contactless check-ins, technology is now central to operational efficiency and service personalisation. Hotels are adopting integrated Property Management Systems (PMS), chatbots for 24/7 virtual concierge services, and dynamic pricing engines to optimize revenue. Mobile apps allow guests to pre-select rooms, control lighting or temperature, order services, and access local travel guides. The pandemic accelerated digital adoption, with features like QR-based menus, voice-activated room service, and keyless entry becoming standard in premium segments.
Data analytics is used to tailor offers based on guest history, demographics, and preferences, enhancing satisfaction and loyalty. Budget hotels and homestays leverage OTA integrations and AI tools for inventory and reputation management. These tech-driven shifts improve operational agility and empower brands to deliver hyper-personalized experiences. Technology is enhancing guest delight while enabling cost control, predictive maintenance, and better workforce utilization, establishing a new standard in Indian hospitality services.
9.2 India’s Defining Moment in Hospitality
As of 2025, India stands at a defining moment in its hospitality trajectory. With record ADRs, RevPAR growth surpassing most Asia Pacific peers, and the largest project pipeline in the region outside China (~88,900 rooms, Q1 2025), the country has moved decisively from recovery to reinvention. Tier-1 metros such as Delhi NCR, Mumbai, and Bengaluru continue to anchor rate discipline and corporate demand, while Tier-2/3 leisure, hill, and pilgrimage hubs are evolving into self-sustaining demand ecosystems.
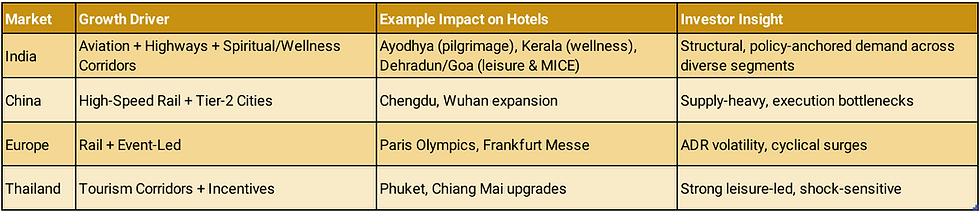
Unlike Europe’s event-led surges (Paris Olympics, Frankfurt Messe) or China’s supply-heavy megacity expansions, India’s growth is multi-nodal, policy anchored, and domestically driven. Aviation and highways are creating new circuits, while pilgrimage and wellness corridors are embedding structural repeat demand. This positions India uniquely: one of the few markets where both scale and diversity of demand are expanding simultaneously.
9.3 The Balancing Act: Resilience vs Fragility
India’s fundamentals are unmatched in Asia — but strength comes with caveats. Resilience: Deep domestic demand (165m flyers in FY2025), rising institutional capital (Juniper Hotels IPO $200m+, Schloss listing $409m), and government programs (Swadesh Darshan 2.0, PRASHAD, Ayush Visa, Heal in India) create structural visibility.
Fragility: Wage inflation (+6–8% YoY), utilities (+2 3% of operational expenditure), GST misalignment (≤$88 ADR slab), and clustered supply in Aerocity, Whitefield, and North Goa risk margin erosion. Climate fragility in Himalayan hill stations and coastal hubs is no longer a peripheral issue but a core risk to asset resilience & financing eligibility.
The global lesson is clear: China’s oversupply cycle (2013–16), Europe’s cost-inflation squeeze (2022 24), and the Maldives’ ecological limits all demonstrate how unchecked risks can erode strong demand cycles. India’s stakeholders must learn from these precedents — demand is not the challenge, delivery discipline is.

9.4 Investor Takeaway: Confidence with Discipline
India’s hotel sector offers a rare combination of scale, premiumization, and resilience. Unlike Thailand, where growth is leisure-heavy and shock sensitive, or Japan, where demand surges are event-driven, India is building a durable, policy anchored cycle across metros, pilgrimage, wellness, and leisure circuits. For global investors, this translates to lower downside risk and a broader spread of opportunities.
Yet the sector’s durability will depend on:
• Owners embedding ESG into capex and targeting policy-linked hubs.
• Operators protecting ADR integrity and navigating GST thresholds with innovation.
• Investors stress-testing models for inflation, foreign exchange, and clustered supply, while prioritising branded assets in demand-assured nodes.
If execution keeps pace with demand, India will not only converge with global hospitality benchmarks but set a new model of multi-nodal, domestically anchored growth for the next decade.
9.5 Executive Wrap-Up
Despite global headwinds and regional volatility, India’s hospitality sector has outperformed forecasts, defied sceptics, and attracted unprecedented capital. This is not a cyclical rebound; it is a structural opportunity, underpinned by:
• Deep domestic demand that cushions global shocks.
• Policy-driven corridors in pilgrimage, wellness, and leisure.
• Institutional capital flows that signal growing investor confidence.
For global stakeholders, India is emerging as Asia’s most resilient, rewarding, and strategically important hospitality market. The window of opportunity is now — and those who enter with confidence and discipline will be positioned to capture durable long-term value.
Sources: Lodging Econometrics – APAC Construction Pipeline Q1 2025; STR/CoStar 2025; MoT 2024; MoCA 2024; HVS ANAROCK 2025; Hotelivate 2024; IMF 2025; RBI 2025; UNWTO 2025


