
APAC Hotel Transactions and Market Outlook – FY 2025 - H1 2026
Updated: 11 minutes ago


Selected Asia Pacific Markets
Australia
China
Hong Kong
India
Indonesia
Japan
Macau
Malaysia
Maldives
New Zealand
Philippines
Singapore
South Korea
Taiwan
Thailand
Vietnam
The following report is based on data gathered from the 16 markets listed above. However, most transactions, and therefore much of the detailed analysis, focus on eight: Japan, China, South Korea, Australia, Singapore, India, Hong Kong, and Thailand.
Executive summary
In 2025, the Asia Pacific region recorded USD 17.0 billion in hotel transactions, up 51.9% from USD 11.2 billion in 2024. The more interesting question is why the market grew by half in a year like this one. Three forces shaped the region in 2025: money, governments and travellers. Money, because it was the last year of cheap borrowing in most of the region. Governments, because two of the region’s largest economies stopped their citizens from travelling between each other, and politicians, rather than markets, decided where tourists could go and what a hotel could be used for. Travellers, because they kept coming regardless. This summary takes each in turn, and looks at how investors responded. The first of these was money. For most of 2025, borrowing costs were still falling. Australia cut rates three times. South Korea cut twice and then held.
American rates fell in the second half, and Singapore and Hong Kong, which follow the United States, fell with them. Japan was the one exception. Its central bank raised rates in January and again in December, ending the near-zero era that prevailed at the time of our last report. Even so, the yen stayed weak, so tourists kept coming and foreign buyers kept looking. The economies underneath were uneven. Korea was carried by semiconductors, India by its own consumers. Japan grew slowly. China’s property sector remained under strain, which is why so many Chinese hotels came to market via auctions, asset managers, and state-owned sellers rather than through a normal sale. Over it all hung the trade dispute. The United States announced sweeping tariffs in April and spent the rest of the year negotiating country by country with Japan, Korea and the others. It unsettled currencies and business confidence. It did not stop the capital.
The second was governments, and 2025 was different. China opened its doors wider than anyone. Around 50 countries could enter without a visa; 30 million people did, and inbound spending climbed back to pre-pandemic levels. South Korea followed, allowing Chinese tour groups to enter visa-free from September. Then, in November, travel flows between China and Japan were disrupted following heightened diplomatic tensions, with Chinese authorities advising citizens against travel to Japan. Within weeks, Chinese arrivals in Japan, the largest source market for the world’s fastest-growing destination, fell by nearly half. India recorded a second consecutive year of softer international visitor arrivals, reflecting the impact of regional uncertainty and disruptions to travel demand. Thailand lost visitors for the first time since the pandemic and began the review that would cut its visa-free stay in half. Hong Kong did something quieter but just as important for hotel owners. It changed the planning rules so that a hotel could be converted into a student hostel without rezoning. Part of the city’s hotel stock became something else in the eyes of investors. The third was the traveller, who kept travelling. The region welcomed 331 million international visitors, six per cent more than the year before, though still short of 2019, the only major region not yet back to its pre-pandemic level. Japan surpassed 40 million for the first time, driven by Expo 2025 Osaka. Korea and Hong Kong set new records for visitor numbers. Five of the eight markets in this report set records for visitor spending. Hotels raised their rates for a third year in a row.
But by the second half, rate increases were slowing, costs were climbing, and in Singapore and Southeast Asia, occupancy, not price, was doing the work. Investors watched all three and bought. 231 transactions, two-thirds more than in 2024, and 51,9% more volume. What they bought is the interesting point. Not the trophies. Luxury volume fell. Upscale, midscale, and economy hotels rose sharply. The average price per room fell, not because hotels got cheaper, but because the market bought cheaper hotels. Japan stayed on top, carried by its own REITs and by portfolios of business hotels, not by cheap debt. China, South Korea, Australia and Singapore filled out the top five. Australia overtook Singapore. India appeared in the ranking for the first time, on the back of a development pipeline that is now the largest in the region outside China. Then 2026 brought a marked shift in market conditions. Escalating geopolitical tensions disrupted shipping through the Strait of Hormuz, driving oil above USD 115 per barrel and placing further pressure on jet fuel costs. Rising energy prices and renewed inflationary pressures also contributed to a reversal in the interest-rate environment, with several central banks moving from easing towards tightening. How the market responded in the first half of 2026, and what it means for hotel owners, is covered in the final sections of this report. We will come back to it. In this report, we will examine hotel transactions from 2025 and the first half of 2026 in detail, analyse market trends, and outline what’s next for the region. All prices in this report have been converted to USD based on the exchange rate in effect at the time the deal was executed. The analysis includes only transactions exceeding USD 20 million.
2025 in Numbers

2025 in Numbers (FY 2025). Source: Global Asset Solutions.
2025 grew on every measure of activity. Transaction volume rose 51.9% against 2024. The number of transactions rose 66.2%. Keys traded rose 88.7%. The two averages fell: the average transaction was 8.5% smaller, and the average price per key was 19.5% lower. The market bought more hotels, bigger hotels and cheaper hotels per room than in 2024. The average hotel sold had 244 rooms, up from 215. This reflects a shift in the segment mix, as shown in the next charts.
Hotel transactions per segment

Total volume and number of transactions per segment, FY 2025. Source: Global Asset Solutions.
2025 showed strong growth for the Upscale and Midscale & Economy segments. Together, they make up around 84% of the total volume. In 2024, they represented 59%. Luxury moved the other way, from 41% of volume to 16%. Japan is the reason. It recorded 92 transactions in 2025, four in every ten across the region, and most of them were Midscale & Economy business hotels.
The weak yen made Japan cheap to visit; arrivals passed 40 million for the first time, and full hotels at moderate rates turned the lower segments into the most profitable part of the market. Investors followed the profit. China did the same, selling large Upscale hotels at low prices per room through auctions and state sellers.
Average transaction, price per key and keys by segment

Average transaction, price per key and keys by segment, FY 2025. Source: Global Asset Solutions.
Share of volume by segment

Share of volume by segment, FY 2025. Source: Global Asset Solutions.
Look inside each segment, and the story changes. Luxury’s average price per key rose 24% to USD 585,000, but there were 23 transactions instead of the 34 in 2024, so a few expensive hotels skewed the average. Upscale fell 17% to USD 314,000 for a simple reason: the hotels sold were bigger, averaging 290 rooms versus 205 in 2024.
Midscale & Economy held at USD 225,000 on almost three times the volume. The market did not decide that midscale hotels were better than luxury hotels. It decided that buying an existing hotel was better than building a new one, and that converting a cheap one was better than either. Both decisions lead to the same two segments.
Why are the lower segments getting all the attention?
In 2025, 84% of investment in Asia Pacific hotels went into Upscale and Midscale & Economy assets. In 2024, the figure was 59%. The number of Midscale & Economy transactions went from 42 to 106. Upscale transactions rose from 63 to 102. Luxury went from 34 to 23. A shift that size in a single year needs an explanation, and it begins on a greenfield building site.
The cost to build
Across the region, the cost of putting up a hotel rose faster than the value of owning one. Construction costs climbed with energy and materials prices. In Japan, the job openings-to-applicants ratio in the accommodation sector averaged 2.14 through 2025, meaning two vacancies for every candidate, and wages and timelines stretched accordingly (Ministry of Internal Affairs and Communications). Interest rates that had been near zero in Tokyo went to 1.00%, and financing a three-year development at those rates changed the arithmetic for every developer. Savills identified construction costs and labour shortages as the bottleneck holding back new hotel completions in Tokyo, Osaka and Kyoto from 2025 onwards, benefiting hotels already standing. The Bank of Japan went further in its 2026 outlook reports, naming hospitality staffing as a constraint on how many rooms the country can offer at all (Bank of Japan).
Projects were cancelled outright: JR Kyushu withdrew its JPY 43.5 billion (USD 291 million) Hakata Station Sky City scheme, and a twin-tower project in Sendai was shelved in November 2025 because of construction costs. Tokyo’s room capacity has not grown since early 2025 (Nikkei Asia, March 2026). The result is visible in the pipeline. New supply is concentrated in India, Vietnam, Indonesia and Thailand, where land and labour are cheaper (Lodging Econometrics). In the gateway cities where capital wants to be, almost nothing is being built. No new hotel rooms opened in Sydney or Hong Kong in the first half of 2026. Seoul added fewer than a hundred. Tokyo’s next luxury openings are dated 2027 to 2030. When you cannot build, you buy. And when everyone decides to buy at the same time, what they buy is whatever already exists.
What exists is the middle of the market
The hotel stock of Asia Pacific is not made of trophies. It is made up of business hotels in Osaka and Tokyo, full-service hotels in Shenzhen and Shanghai, and limited-service assets in the suburbs of Australian cities. That is the product that came to market in 2025, and that is what our records show. Japan shows it most clearly. Japan recorded 92 transactions in 2025, more than double the year before, and across the eighteen months to June 2026, 90 of its 122 transactions were Midscale & Economy hotels. They traded at about USD 242,000 per room. These are hotels built in the last two decades, operating at high occupancy on domestic and inbound demand, and costing far less to buy than to replace. Osaka alone recorded 23 transactions, none of which involved luxury assets. China shows the same pattern with a different seller. Large Upscale hotels came to market through auctions, asset management companies and state- related owners, at an average of USD 219,000 per room in 2025.
Keys traded doubled while the price per room fell by 30%. In Shenzhen, foreclosed and distressed assets made up the majority of large commercial property transactions in the first half of 2026, as banks, asset managers and state-owned enterprises sold down holdings. Buyers were not paying for quality. They were paying for square metres of existing hotels at a price no developer could match. Australia adds the third variant. Its Midscale & Economy transactions traded at USD 120,000 per room, the lowest in the region, because they were large limited service hotels outside the city centres. Nine of them changed hands in eighteen months. The same money would not have built one. The average hotel sold in 2025 had 244 rooms, against 215 in 2024.

BUILD OR BUY
That is the buy side of build-or-buy: bigger, older, cheaper assets bought because building them again was out of the question.
Convert
The third option changed the shape of an entire market. Hong Kong’s non-local student population more than doubled in a decade, from ~27,000 in 2015-16 to ~76,000, while its universities could offer about 40,600 dormitory places for 103,400 students (South China Morning Post, citing Education Bureau data). The government then raised the cap on non- local students to 50% and, in July 2025, launched the Hostels in the City Scheme, widening the planning definition of a hotel to include student hostels so that conversions require no rezoning (Government of the Hong Kong SAR). The permanent secretary for development said the market would decide which low- to mid-priced hotels became hostels (South China Morning Post, June 2025). The market did. By January 2026, the scheme had received 24 applications for about 5,000 beds, and in February, a China Resources subsidiary paid about USD 122 million for a hotel in Kwai Chung to create 900 of them (Government of the Hong Kong SAR; South China Morning Post). Our records show what that did. In 2024, Hong Kong traded 718 keys at about USD 613,000 per room.
Why Luxury sat it out
Luxury followed a different investment dynamic. Whilst higher room rates can support the economics of new development, much of the capital targeting the segment in 2025 was directed towards new luxury projects scheduled to open from 2027 onwards, rather than existing assets. Existing luxury hotels generally offered fewer opportunities for yield- driven acquisitions or conversion strategies. Despite transaction activity declining by approximately one- third, the average price per room increased by 24%, indicating that values remained resilient even as transaction liquidity declined.
In 2025, it traded 1,995 keys at USD 252,000. Keys up 177.9%, price per room down 58.9%, in a single year. Over the eighteen months to June 2026, seventeen hotels changed hands: USD 504 million in Upscale and USD 449 million in Midscale & Economy. Not one was Luxury. That is what conversion capital looks like. The buyer's exit value is a student bed, not a hotel room, so the entry price per room has to be low. A Luxury hotel at USD 700,000 per room cannot be turned into anything that pays for itself. A three- star hotel in Kowloon at USD 250,000 can. Hong Kong is the extreme case, but the conversion channel runs through the whole region. Singapore’s small hotels became co-living under lyf by Ascott (co-living / lifestyle) and comparable brands. Seoul’s vacant- possession hotels were rebranded rather than rebuilt because rebranding reaches the market in months, while a new build takes years. Renovation and conversion projects across the region rose 36% in a year (Lodging Econometrics). Every one of those projects starts with the purchase of an existing mid- market hotel.
Quarterly trends
Six quarters in one picture: volume by segment and number of transactions, Q1 2025 to Q2 2026

Six quarters in one picture: volume by segment and number of transactions, Q1 2025 to Q2 2026. Source: Global Asset Solutions.
2025 began at the pace of 2024 and then broke away from it. The first quarter recorded 37 transactions, within the 32-37 range observed in every quarter of 2024. From the second quarter onward, the market moved to a new level: 62, 73, and 59 transactions. Every quarter after the first beat every quarter of 2024.
The third quarter was the largest in our series, 55% above the largest quarter of 2024. Three transactions above USD 440 million closed in those three months: Hyatt Regency Tokyo, Shenzhen Bay Exhibition International Hotel, and JW Marriott Hotel Singapore South Beach.
Why was Q3 so active?
Four things came together between July and September 2025.
The first was trade. The United States announced sweeping tariffs in April 2025, and for three months, buyers and sellers paused. Then the deals came: Japan on 22 July at a 15% tariff, the European Union on 27 July, South Korea at the end of the month, and an extended truce with China on 12 August (Congressional Research Service; Thomson Reuters). Transactions negotiated in the spring closed once the terms were known. That alone explains part of the jump from 62 transactions in the second quarter to 73 in the third. The second was money. The third quarter was the last time every major market had stable or falling rates. Australia cut in August to 3.60%. Korea held at 2.50%. Japan held at 0.50% until December. The Federal Reserve made its first cut of the year in September. Debt was as cheap as it was going to get, and investors were moving accordingly. The third was Japan's calendar. The Japanese fiscal half-year ends on 30 September, and REITs and corporates close before then. In 2025, global funds took profits, and domestic institutions bought income.
The Hyatt Regency Tokyo is an example: KKR and Gaw Capital sold it in July 2025, and Japan Hotel REIT completed the purchase in March 2026 for about USD 834 million. Record inbound demand and Expo 2025 in Osaka gave both sides confidence in the numbers. The fourth was sellers under pressure. A public body transferred the Shenzhen Bay Exhibition International Hotel in August, part of a run of state-related disposals in China. City Developments sold its South Beach interest, including the JW Marriott, to IOI in September to reduce debt. Sellers who need proceeds on the balance sheet sell before year-end. None of the four repeated in 2026. Trade terms were set, rates turned upwards, the Japanese exits had been taken, and the war in the Middle East from 28 February changed the mood. The averages tell the segment story. Price per key was lowest in the second and third quarters, when Japanese business hotels and large Chinese Upscale hotels dominated, and highest in the fourth, when nine Luxury transactions closed at USD 692,000 per key.
Transactions per quarter per segment
Number of Transactions per quarter per segment

Transactions per quarter per segment, count. Source: Global Asset Solutions.
Total keys transacted per quarter per segment

Total keys transacted per quarter per segment. Source: Global Asset Solutions research.
Average transaction price by segment
USD millions.

Average transaction price by segment. Source: Global Asset Solutions.
Average price per key by segment

Average price per key by segment. Source: Global Asset Solutions.
Upscale was the steady base. Its volume exceeded USD 1.4 billion in each of the six quarters and USD 2.3 billion in three. Midscale & Economy was the variable. Its count rose from 18 in the first quarter of 2025 to 42 in the third quarter, when Japanese business hotel activity peaked, then fell back to 18 in the fourth quarter. Luxury never exceeded nine transactions in a quarter and recorded two in the first quarter of 2026, so its price per key for that quarter rests on too small a base to read.
Within each segment, pricing is held through 2025. Upscale’s average price per key stayed between USD 285,000 and USD 360,000 in every quarter. Midscale & Economy stayed between USD 195,000 and USD 235,000 over three quarters, then rose to USD 360,000 in the fourth quarter due to a small number of high-priced Tokyo assets. Luxury moved most, because a handful of transactions each quarter set the average. The regional average moved because the mix moved. No segment repriced.
Where is the money being spent?

Ranking of markets per total volume of transactions, 2025. Source: Global Asset Solutions.
All seven markets with a 2024 comparison grew in volume except Thailand. The top did not move. Japan, China and South Korea held the top three places and together accounted for 66.0% of regional volume, down from 71.4% in 2024. The movement was in the middle. Australia rose from fifth to fourth on volume, which more than doubled.
Singapore slipped to fifth despite growing 54.5%. India entered the table at sixth with USD 1.1 billion across 13 transactions, having sat below the ranking threshold in 2024, and ahead of Hong Kong and Thailand. Thailand was the only market to shrink, with five transactions down to four, and it is the only market in the table where arrivals also fell in 2026.
Market totals
FY 2025

Market totals, FY 2025. Other markets: 13 transactions, USD 0.8 billion. Source: Global Asset Solutions research.
H1 2026

Market totals, H1 2026. Other markets: 6 transactions, USD 0.4 billion. Source: Global Asset Solutions.
What moved, and what did not
Japan’s share of regional volume fell from 39.3% to 36.8% even as its volume grew 42.4%. The region grew faster than its largest market, which is the healthiest reading of this table. Average pricing moved down in six of the seven comparable markets. Singapore was the exception, up 4.0% per key. The largest falls, Hong Kong at 58.9% and Thailand at 51.8%, are a change in what was traded rather than a repricing of comparable hotels. Hong Kong’s average asset size doubled as conversion candidates were acquired. Thailand’s five transactions were larger, lower- priced resort and economy assets. The first half of 2026 kept the top three in place. Japan and China accounted for 58 of the 90 transactions, and South Korea ranked third. Below them, Hong Kong rose to fourth on its conversion channel, with six months of volume already equal to 90% of its full-year 2025. Australia, India, and Singapore each recorded a quiet half after a strong 2025. Singapore recorded one transaction and Thailand one. What the half-year means is the subject of the closing section.
WHAT THIS MEANS FOR OWNERS
A 58.9% fall in Hong Kong’s price per key is not a repricing of comparable hotels. It is a change in what came to market. Read every market average against the asset mix behind it before drawing a conclusion about value.
Ranking of markets per total volume of transaction

Ranking of markets, FY 2024, FY 2025 and H1 2026. Source: Global Asset Solutions.
APAC Investment Concentration: The Big 3
Three markets accounted for two-thirds of all investment in Asia Pacific hotels between January 2025 and June 2026. Japan, China and South Korea recorded 218 of the 321 transactions and USD 14.9 billion of the USD 22.1 billion, 67.5% of the volume. The next five, Australia, Singapore, India, Hong Kong and Thailand, shared 27.5%. Everyone else together accounted for 5.0%.

Total volume per market, January 2025 to June 2026. Source: Global Asset Solutions.
The key players in Asia Pacific
Number of transactions per market

Number of transactions per market, January 2025 to June 2026. Source: Global Asset Solutions.
Total keys per market
Total keys per market, January 2025 to June 2026. Source: Global Asset Solutions.
Volume by segment per market
January 2025 to June 2026 combined. Volume inside each bar; the small figure above each segment is its number of transactions.

Volume by segment per market, January 2025 to June 2026. Source: Global Asset Solutions.
Japan

Japan, transactions by segment, January 2025 to June 2026. Source: Global Asset Solutions.
Transactions. Japan recorded 92 transactions in 2025, USD 6.3 billion and 18,600 keys. Against 2024, the count more than doubled, up 114%, and volume rose 42.4%. The average transaction fell by a third to USD 68.1 million, and the average price per key fell 12% to USD 337,000. Japan bought many more hotels, and smaller and cheaper ones. Over the eighteen months to June 2026, 90 of its 122 transactions were for Midscale & Economy hotels, at about USD 242,000 per room. Upscale was 28 transactions, lifted by two acquisitions by Japan Hotel REIT. Luxury was four. Tokyo led the region with 38 transactions and USD 2.9 billion. Osaka recorded 23, with no luxury assets among them; Fukuoka, 16; and Kyoto, 8. The first half of 2026 registered 30 transactions and USD 1.6 billion in value, about a quarter of 2025's volume.
Investment market. The buyers changed. In the previous edition, Japan’s volume rested on near-zero rates and a weak yen. In 2025, the Bank of Japan raised its policy rate to 0.50% in January, 0.75% in December, and 1.00% in June 2026, the highest in about three decades. Ten-year bond yields reached their highest level since 1997 (Bank of Japan; Ministry of Finance). Volume rose anyway, because domestic institutions bought income. Japan Hotel REIT completed the two largest purchases in the region: the Hilton Fukuoka Sea Hawk for about USD 415 million in February 2025 and the Hyatt Regency Tokyo for about USD 834 million in March 2026. Below the headline, private funds and leasing companies traded business hotels in Osaka and Tokyo at prices that were supported by operating cash flow without leverage. By the second quarter of 2026, Japanese real estate investment across all sectors was down 27% year on year, with early signs of a gap between what buyers offer and what sellers accept (Savills).
Political environment. Japan changed prime minister in October 2025. On 14 November, after the new prime minister told the Diet (Japan’s national parliament) that a Chinese use of force against Taiwan could constitute a survival-threatening situation for Japan, the Chinese Foreign Ministry advised its citizens to avoid travelling to Japan (Chinese Ministry of Foreign Affairs; Bloomberg). Chinese arrivals fell around 45% in December and 58% in the second quarter of 2026 (JNTO). Trade policy went the other way. A trade agreement with the United States on 22 July ended three months of uncertainty. Several cities, including Kyoto, raised accommodation taxes. Expo 2025 ran in Osaka from April to October and carried the Kansai market through the year.
Travel and expenditure. Japan received 42.7 million international visitors in 2025, up 15.8% and the first year above 40 million. South Korea sent 9.5 million, China 9.1 million and Taiwan 6.8 million, and twenty of 23 major markets set records. Visitors spent JPY 9.5 trillion (USD 63.5 billion), up more than 17% (JNTO). The first half of 2026 brought 21.1 million, down 2%, as growth from Taiwan, Hong Kong, India, Europe, and the Middle East offset part of the Chinese decline. Tokyo kept the strongest rate growth in the region. RevPAR was still up more than 15% in July 2026, and luxury occupancy was near 75%, while rate growth in upscale and midscale slowed (STR/CoStar, as reported by Truist Securities). Foreign guests made up 57.1% of Tokyo guest nights in the first quarter of 2026 (JNTO). Supply is not following demand. Tokyo’s room capacity has not grown since early 2025, and the next luxury openings are dated 2027 to 2030 (Nikkei Asia; operator announcements). The government still targets 60 million visitors and JPY 15 trillion by 2030 (USD 100.3 billion).
Japan: Investor Takeaways
Japan has moved from a currency and rate story to an operating story. The deal count doubled at flat prices, without cheap debt and, from December, without its largest source market. Concentration in Chinese demand is now a visible underwriting risk. The slowdown to 30 transactions in the first half of 2026 matches the wider Japanese investment market rather than anything specific to hotels.
China

China, transactions by segment, January 2025 to June 2026. Source: Global Asset Solutions.
Transactions. China recorded 41 transactions in 2025, USD 3.0 billion and 13,697 keys. Against 2024, the count rose 36.7%, volume rose 42.5%, and keys more than doubled. The average price per key fell 31.1% to USD 219,000, the largest fall among the large markets, while the average asset grew from 221 to 334 rooms. Across the eighteen months to June 2026, Upscale accounted for 48 of 69 transactions and 73% of volume at USD 185,000 per room. Luxury accounted for only five transactions, including the Andaz Shanghai at about USD 330 million. Shanghai recorded 11 transactions and USD 0.9 billion. The first half of 2026 recorded 28 transactions, already 68% of the 2025 count, at USD 160,000 per room, the lowest price per key of any market.
Investment market. China’s market is domestic, and its sellers are under pressure. Banks, asset management companies and state-owned enterprises are liquidating holdings, and many of the hotels they sell never reach a broker. When a lender forecloses, the court sells the property through an online judicial auction on Alibaba or JD.com, the same platforms that sell consumer goods, where anyone can see the reserve price and bid. In Shenzhen, foreclosed and distressed assets of this kind made up the majority of large commercial property deals in the first six months of 2026. A municipal planning bureau transferred the Shenzhen Bay hotel to a cultural tourism company. Private owners are the most active buyers in Shanghai and prefer small total outlays in prime locations. Insurance capital is active in portfolios, and across all sectors, Chinese investment rose 140% year on year in the second quarter of 2026 from a low base (Savills). The extension of the C-REIT programme to commercial real estate, including hotels, opens a new exit route. Property sector strain remains the reason hotels reach the market at prices set to clear rather than to maximise.
Political environment. China ran the most open entry policy in the region. Unilateral visa-free entry covers around 50 countries, mutual arrangements cover a further 29, and 240-hour transit covers 55 countries, extended to the end of 2026 and widened again in March 2026 with electronic visas and online entry cards. Visa-free entries reached 30.1 million in 2025, 73% of foreign arrivals (Ministry of Culture and Tourism). Outbound, the advisory against travel to Japan in November 2025 sent Chinese demand to South Korea, Hong Kong, Southeast Asia and home. Trade tensions with the United States eased in stages. The tariff truce was extended in August 2025, and both sides implemented reductions in November (Congressional Research Service). The government’s targets are 190 million inbound visits and USD 150 billion in spending by 2030.
Travel and expenditure. China recorded 154.5 million inbound visits in 2025, up 17.1%, including 35.2 million foreign nationals. Inbound spending exceeded USD 131 billion, up 39.2% and the highest since 2019. Domestic trips passed 6.5 billion, with spending of RMB 6.3 trillion (USD 876.5 billion), up 9.5% (Ministry of Culture and Tourism; Ministry of Commerce). Shanghai received 5.3 million international visitors in the first half of 2026, up 27.8%, and Beijing received 2.7 million in the first five months, up 35.3%. Hotel performance did not follow. National RevPAR fell 2.9% in July 2026 as supply continues to grow: Shanghai has more than 380,000 rooms and Chengdu more than 150,000 (STR/CoStar). The upper tier held. Shanghai’s five-star hotels ran at 69.9% occupancy with ADR up 5.6% to RMB 1,001 (USD 146) in the first half of 2026 (Shanghai Municipal Statistics Bureau). The pipeline stood at 3,602 projects and 640,328 rooms, 71% under construction (Lodging Econometrics).
China: Investor Takeaways
China is a volume market at low per-room prices, with a widening pool of forced sellers and a domestic buyer pool. Volume up 42.5% and price per key down 31.1% is the signature of discounted supply clearing through secondary channels while operating performance stays flat. Record inbound spending supports the gateway cities. Everywhere else, supply growth sets the price.
South Korea

South Korea, transactions by segment, January 2025 to June 2026. Source: Global Asset Solutions.
Transactions. South Korea recorded 18 transactions in 2025, USD 2.0 billion and 4,662 keys, with volume up 32% against 2024. The average transaction was USD 110 million, second only to Singapore. The average price per key was USD 425,000, also second, though down 12%. Over the eighteen months to June 2026, Upscale accounted for 14 of 27 transactions and 66% of volume at USD 400,000 per room. Luxury was two transactions, including the Conrad Seoul at about USD 657,000 per room. Midscale & Economy traded at USD 332,000 per room, the highest lower- tier price in the region. Seoul accounted for 91% of Korean volume with 23 transactions and USD 2.6 billion. The first half of 2026 recorded nine transactions and USD 0.8 billion at USD 347,000 per room.
Investment market. Domestic managers, refilled by large blind-pool allocations from institutional investors, are outbidding foreign capital for core assets, and cross-border interest has shifted to logistics. Korean investment across all sectors fell 22% year on year in the second quarter of 2026, following a record year in 2025 (Savills). The Bank of Korea held its base rate at 2.50% from May 2025 through June 2026, so every Korean transaction in this report closed in a stable rate environment. It then rose to 2.75% on 16 July and 3.00% on 27 August 2026, citing inflation of 3.2%, the won, Seoul housing prices and household debt, and lifted its growth forecast to 3.3% on semiconductor exports (Bank of Korea). The won traded near 16-year lows, making Korean assets cheaper for foreign buyers.
Political environment. Korea introduced visa-free entry for Chinese tour groups from 30 September 2025, and Chinese arrivals rose by 16% in the first month (Korea Tourism Organisation). The rift between China and Japan then prompted more Chinese travellers to travel to Korea. The United States and Korea announced a tariff framework at the end of July 2025. The government’s target is 30 million visitors by 2029.
Travel and expenditure. Korea received 18.9 million visitors in 2025, a record and 8.2% above its 2019 peak. Japanese visitors reached 3.6 million. The first five months of 2026 saw 8.7 million visitors, up 21% (Korea Tourism Organisation). Spending has not kept pace. Per capita spending was 17% below 2019 levels in the first half of 2025, cruise passenger numbers rose fivefold, duty-free sales fell by more than half, and the tourism balance ran a deficit (Yanolja Research, citing Bank of Korea data). Hotels did well regardless. Korea was among the region's strongest RevPAR markets in the first half of 2026, and new supply is limited by site scarcity (STR/CoStar).
South Korea: Investor Takeaways
Korea’s growth and second-highest per-room pricing rested on stable rates, a weak won, record arrivals and tight supply. Two of those four changed in July and August 2026. The next edition will show whether pricing held steady through the first three years of rate rises.
Australia

Australia, transactions by segment, January 2025 to June 2026. Source: Global Asset Solutions.
Transactions. Australia recorded 30 transactions in 2025, USD 1.7 billion and 7,771 keys. Volume rose 153% against 2024, the count 77%, and Australia moved from fifth to fourth place. The average transaction rose 43% to USD 56.1 million, the average asset grew from 167 to 259 rooms, and the average price per key eased 7% to USD 217,000. Over the eighteen months to June 2026, Upscale accounted for 21 of 34 transactions and half of the volume, at USD 257,000 per room. Luxury was four transactions at USD 673,000 per room, the highest Luxury price among the large markets, including the Park Hyatt Melbourne and the Ritz-Carlton Perth. Midscale & Economy traded at USD 120,000 per room, the lowest in the region, for large limited- service hotels outside city centres. The first half of 2026 recorded four transactions and USD 0.3 billion, most of it the Ritz-Carlton Perth at about USD 201 million.
Investment market. Offshore capital is the main buyer, on the view that repricing has created entry points. Domestic investors are more cautious. Australian investment across all sectors rose 24% in the first half of 2026, driven by large single transactions (Savills). Tight yields in student housing and build-to-rent are pushing some capital toward hotels for income. The Reserve Bank cut rates three times in 2025 to 3.60%, then raised rates three times between February and May 2026 to 4.35% in response to energy-driven inflation, and held rates in June and August (Reserve Bank of Australia). Debt costs rose, due diligence lengthened, and sellers reassessed pricing. Construction costs rose faster still, so the gap between building and buying widened in favour of buying.
The political environment was fairly stable. The energy shock of 2026 fed straight into the Reserve Bank’s decisions, which is the political event that mattered most for hotel owners. Western Sydney International Airport is scheduled to open in late 2026.
Travel and expenditure. Australia received 8.9 million international visitors in 2025 and a record AUD 39.2 billion (USD 25.3 billion) in international visitor spend. Total visitor spend reached AUD 192.4 billion (USD 124.1 billion), up 6.5% (Tourism Research Australia). Arrivals from China rose 18% to 1.1 million in the 2025 to 2026 financial year (Australian Bureau of Statistics). Sydney received 3.9 million international visitors in the year to March 2026, up 8.4%. Performance split by city. Sydney grew occupancy, rate and RevPAR, while Melbourne’s RevPAR fell 6.8% year on year in July 2026 and is forecast to decline for the year, according to CoStar. No new hotel rooms opened in Sydney in the first half of 2026.
Australia: Investor Takeaways
Australia’s 2025 was the strongest in the series, and its first half of 2026 was quiet, with only USD 0.3 billion across four transactions. Two things still support hotel values in Australia. International visitors spent a record AUD 39.2 billion (USD 25.3 billion) in 2025, and Sydney added no new rooms in the first half of 2026, so its hotels are filling up at higher rates without new competition.
Singapore
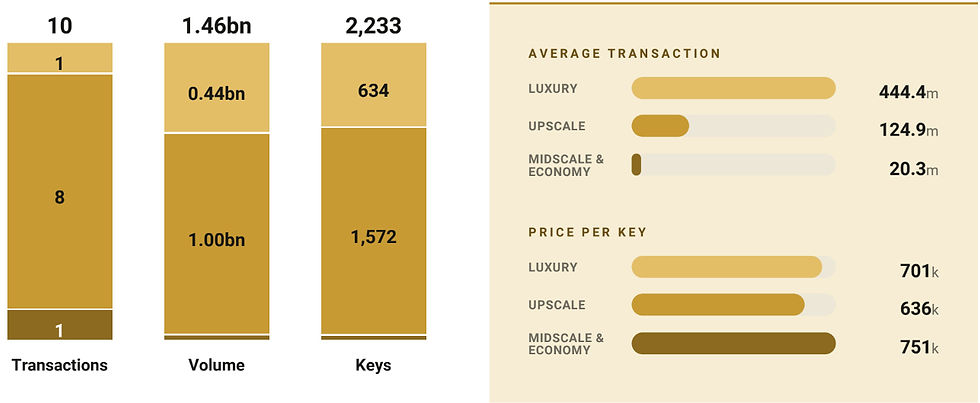
Singapore, transactions by segment, January 2025 to June 2026. Source: Global Asset Solutions.
Transactions. Singapore recorded nine transactions in 2025, USD 1.4 billion and 1,982 keys, with volume up 54.5% against 2024. It slipped from fourth to fifth place as Australia overtook it. The average transaction rose 20% to USD 153.8 million, and the average price per key rose 4% to USD 698,000, both the highest in the region and the only per-room increase among the comparable markets. Over the eighteen months to June 2026, Upscale accounted for eight of ten transactions and 68% of volume at USD 636,000 per room. The single Luxury transaction was the JW Marriott Hotel Singapore South Beach.
The first half of 2026 recorded one transaction of about USD 80 million.
Investment market. Singapore’s investment across all sectors rose 49% in the first half of 2026, driven by large transactions, with cross-border capital stronger here than anywhere else in the region (Savills). Family offices and regional wealth use the city as a base. The Monetary Authority of Singapore manages the exchange rate rather than a policy rate, and local borrowing costs stayed below hotel yields. Stability drew capital during the conflict months. The hotel market itself was quiet in the first half of 2026.
Political environment. Mutual 30-day visa-free travel with China, in place since February 2024, underpins the largest source market. Events are policy: the Milken Institute anchored its Asia Summit in Singapore for 2026 to 2028, and the city ranked second globally for conventions. The Tourism 2040 strategy targets SGD 47-50 billion (USD 36.0–38.3 billion) in receipts.
Travel and expenditure. Singapore received 16.9 million visitors in 2025, up 2.3%, and set a record for tourism receipts at SGD 32.8 billion (USD 25.1 billion), above forecast. Mainland China sent 3.1 million visitors, Indonesia 2.4 million, Malaysia and Australia 1.3 million each, and India 1.2 million. Changi handled a record 70 million passengers. The Board forecasts 17 to 18 million visitors in 2026 but lower receipts, citing the Middle East conflict's effect on long-haul demand (Singapore Tourism Board). Hotels ran at 81.9% occupancy in the first nine months of 2025, with an average rate of SGD 273.56 (USD 209), slightly below 2024 levels, so growth came from occupancy rather than rate. Room inventory has grown by less than 2% in five years.
Singapore: Investor Takeaways
Singapore remains the per-room outlier, but the outlier's shape has changed. The previous edition recorded Luxury above USD 1.22 million per room on boutique assets. This window records one Luxury transaction at USD 701,000 and a market anchored by large Upscale hotels at USD 636,000. Record receipts, the region's highest occupancy and almost no new supply are why Singapore costs more per room than anywhere else. The averages are another matter. Ten sales in eighteen months is a thin market, and when so few hotels trade, the one that does sets the figure.
India

India, transactions by segment, January 2025 to June 2026. Source: Global Asset Solutions.
Transactions. India recorded 13 transactions in 2025, USD 1.1 billion and 3,390 keys, and entered the market ranking at sixth place for the first time. The average transaction was USD 85.9 million, and the average price per key was USD 329,000, both above those in Japan and China. Across the eighteen months to June 2026, seven Luxury transactions accounted for 48% of volume at USD 490,000 per room, and nine Upscale transactions accounted for 49%, making India the most Luxury-weighted market in this report. Midscale & Economy was a single transaction. The first half of 2026 recorded four transactions and USD 0.2 billion.
Investment market. Transactions are few for the size of the market, and several were stressed resolutions or platform stakes. A Blackstone and Panchshil venture acquired 76% of the owner of Hilton Goa Resort for about USD 35 million, and a consortium acquired the 316-key Chedi Mumbai through an insolvency process for about USD 59 million. Land tenure and title complexity limit foreign single asset purchases, so capital enters through development and platform equity. The pipeline is the largest in the region outside China: 1,033 projects and 137,601 rooms, up 36% and 39% in a year (Lodging Econometrics).
Political environment. India’s inbound market was hit by politics three times in fifteen months. A diplomatic rupture with Bangladesh caused arrivals from its largest source market to collapse. The Pahalgam attack in April 2025 and the hostilities with Pakistan in May closed Pakistani airspace to Indian airlines. The 2026 war then cut the Gulf air corridors that carry most long-haul visitors, and an industry body estimated a 15% to 20% fall in inbound traffic (PHD Chamber of Commerce and Industry). The United States raised tariffs on Indian goods to 50% in August 2025 (Thomson Reuters). Against that, 3.2 million tourist e-visas were issued in the twelve months to November 2025 (Bureau of Immigration).
Travel and expenditure. Foreign tourist arrivals fell by 9.4% to 9.0 million in 2025, marking a second consecutive decline, while foreign exchange earnings from tourism rose by about 8% to USD 29- 31 billion (Ministry of Tourism, India). Domestic demand, corporate travel and MICE carry the hotel market. Domestic tourist visits reached 2.95 billion in 2024. India led the region’s RevPAR growth in July 2026 at 17.6%, Mumbai’s occupancy held above 85%, and Delhi and Bengaluru grew on domestic demand (STR/CoStar).
India: Investor Takeaways
India combines the region’s fastest RevPAR growth and its largest pipeline with a thin transaction market and falling foreign arrivals. Capital is arriving through development and through stakes in hotel platforms rather than through hotel purchases, because building or buying into a company is easier than buying a hotel. Unclear land titles, high transfer taxes, limits on foreign ownership of single assets and slow insolvency courts make each purchase a long process.
Overall price per key comparison

Price per key by market and segment. Source: Global Asset Solutions.
COUNTRY TOTALS · FY 2025 AND H1 2026

Source: Global Asset Solutions research, January 2025 to June 2026 combined.
Singapore remains the outlier, at USD 656,000 per key across all segments and USD 636,000 in Upscale alone, more than half again as much as the next market. This period records one Luxury transaction, a 634-room hotel at about USD 701,000. Singapore’s position has not changed. The asset type producing it has. South Korea holds second place across all segments at USD 398,000, and it is the only market where Midscale & Economy assets trade above USD 300,000 per key.
Japan and China again show similar Upscale-to- Midscale ratios, but Japan’s Upscale tier now sits at USD 467,000 against China’s USD 185,000, a gap that did not exist in the FY 2024 edition. Two large REIT acquisitions in Japan and a run of discounted secondary sales in China drove the gap. Australia has the widest range: USD 673,000 in Luxury and USD 120,000 in Midscale & Economy. The lower figure reflects large, limited-service hotels outside the Sydney CBD and should not be read as a national price level.
Top cities and segment concentration
January 2025 to June 2026 combined. Top ten cities took 59.8% of regional volume.

Top cities in transaction volume. January 2025 to June 2026 combined. Source: Global Asset Solutions.
The ten largest cities took 59.8% of regional volume and 48.9% of transactions in the eighteen months to June 2026. Four of the ten are Japanese. Tokyo, Osaka, Fukuoka and Kyoto together recorded 85 transactions and USD 6.2 billion, 27.9% of everything traded in the region, and Tokyo displaced Seoul as the largest city market. Osaka is the clearest single- city example of the segment shift: its 23 transactions contained no Luxury assets and more Midscale & Economy volume than Upscale volume. Shenzhen enters the ranking with five transactions. The list also indicates where the Asia-Pacific capital is willing to go. All ten are major cities. None is a resort market, and none is a coastal destination. Our European report tells a different story.
There, Tenerife and Lanzarote in Spain, Vouliagmeni in Greece, and Eze on the French Riviera sat alongside Paris, London, and Berlin, with a handful of Luxury resort sales each carrying large amounts of capital. In the Asia-Pacific, the money follows the main airport, the business district, and the convention centre. Tokyo, Osaka, Shanghai, Seoul, Singapore and Sydney are gateway cities first and leisure destinations second. The segment picture is the same in every one of those cities. Upscale held 54.6% of 2025 volume, Midscale 29.3%, and Luxury 16.1%. The FY 2024 edition reported the equivalent tiers at 43.7%, 15.2% and 41.1%. The lower two tiers took 83.9% of the market in 2025, up from 58.9% the year before. Across the eighteen months to June 2026, the split was 55.0%, 29.8% and 15.2%.
Largest deals 2025

Largest deals 2025. Source: Global Asset Solutions.

1. Hyatt Regency Tokyo (Tokyo, Japan), USD 834m
The Hyatt Regency Tokyo in Shinjuku changed hands twice in eight months, and our records treat the two steps as one sale, dated to the first. In July 2025, a consortium of KKR, Gaw Capital, MDM and EGW Asset Management sold the 712-room hotel to GK Midtown Tokyo, a special purpose company formed in February 2025 and advised by Japan Hotel REIT’s asset manager. The parties did not announce the sale. The Wall Street Journal first reported it on 24 November 2025, and Gaw Capital confirmed it without naming the buyer or the price. Neither party has disclosed the price. Market reports put it at about JPY 120 billion (approximately USD 814 million, as reported by Mingtiandi), or about USD 1.1 million per key. That is above the USD 788,000 per key that the Grand Nikko Tokyo Daiba recorded in November 2024, the highest Jap
anese figure in the previous edition. The consortium had owned the hotel since 2023 and completed a JPY 9.4 billion (USD 64 million) renovation of the rooms, lobby and restaurants in July 2025, immediately before the sale. The Hyatt brand continued through the sale. The second sale explains the first. Japan Hotel REIT Investment Corporation completed the acquisition with GK Midtown Tokyo on 13 March 2026 for JPY 126 billion, about USD 834 million.
The REIT funded the purchase with a JPY 61.8 billion (USD 409 million) equity issue and JPY 65 billion (USD 430 million) in new borrowing, neither of which was in place as of July 2025. The vehicle bought the hotel when the sellers wanted to sell, and the REIT bought it from the vehicle when the REIT was able to pay. In the same transaction, the sponsor’s hotel management company took over the tenant company that operates the hotel under a Hyatt franchise. Our records count the Hyatt Regency Tokyo once, in 2025, when the hotel left its previous owners. The July 2025 price was never disclosed, so the record carries the transaction at the price the final buyer disclosed, USD 834 million. The REIT’s March 2026 purchase completed that sale rather than starting a new one, so it is not counted again in the first half of 2026. The sequence also answers a question left open in the FY 2024 edition. That edition read Mizuho Leasing’s role in the Hilton Fukuoka Sea Hawk as a warehousing step between GIC and the REIT and asked whether the pattern would recur. It did, and this time the REIT’s filing says so. The two largest Japanese hotel purchases in this record have followed the same route: a global fund sells to a domestic vehicle, and a listed REIT completes the purchase later.

2. Shenzhen Bay Exhibition International Hotel (Shenzhen, China), USD 475m
The Shenzhen Bay Exhibition International Hotel was transferred on 22 August 2025 for approximately USD 475 million. The seller was the Bao’an Management Bureau of the Shenzhen Municipal Planning and Natural Resources Bureau, and the buyer was Shenzhen Futian Cultural Tourism City Service. It was the largest hotel transaction in China in 2025 and the second largest in the region.
The transaction is a public-body transfer through a listing process rather than an open-market sale between private parties, and the price should be read in that light. Public information on the hotel’s operating position, brand and future plans is limited. No repositioning plan has been disclosed.

3. JW Marriott Hotel Singapore South Beach (Singapore), USD 444m
IOI Group acquired the 634-room JW Marriott Hotel Singapore South Beach from City Developments Limited in September 2025 for an attributed value of approximately USD 444 million, or about USD 701,000 per key. The hotel formed part of IOI Properties Group’s acquisition of City Developments Limited’s interest in the South Beach mixed-use development, and the hotel value is the allocation recorded in our data.
The transaction was the largest in Singapore in 2025 and the only Luxury transaction in the market across the eighteen months to June 2026. The hotel continues under the JW Marriott brand with Marriott International as operator. The buyer already held the remaining interest in the development, so the transaction consolidates ownership rather than introducing a new owner. No repositioning plan has been disclosed.
How 2026 is looking
What the first half of 2026 tells us

H1 2026 in Numbers. January to June 2026, reported on its own. Source: Global Asset Solutions.
Ninety transactions and USD 5.1 billion in six months is a liquid market. Forty-five transactions in each quarter are above every quarter of 2024. The mix is unchanged from 2025: Upscale holds 56.2% of volume, Midscale & Economy 31.4% and Luxury 12.3%.
Over the eighteen months from January 2025 to June 2026, our records show 321 transactions, USD 22.1 billion, 77,267 keys, an average transaction size of USD 68.9 million, and an average price per key of USD 286,000. We use this combined window only where our records include that level of detail: the segment split by market and the city ranking.
Transactions per segment

H1 2026 transactions per segment. Source: Global Asset Solutions.
The first half of 2026 kept the 2025 shape. Upscale accounted for 56.2% of volume across 42 transactions, Midscale & Economy for 31.4% across 40, and Luxury for 12.3% across 8.
The Luxury average price per key was USD 384,000 on eight deals. The Upscale average fell further to USD 241,000, and the Upscale asset stayed large at 284 keys per transaction.
Where the money went

H1 2026 volume by market. Source: Global Asset Solutions research.
Japan and China supplied 58 of the 90 transactions in the first half of 2026.
Notable deals of the first half of 2026

Notable deals 2026. Source: Global Asset Solutions.


1. Centara Grand Hotel Osaka (Osaka, Japan), USD 247m
Nomura Real Asset Investment acquired the Centara Grand Hotel Osaka for approximately USD 247 million in March 2026 from Kanden Realty & Development, Taisei Corporation and Centara Hotels & Resorts, the three partners that developed the hotel. The hotel opened in 2023 in Namba and was the first Centara property in Japan.
It was Japan's largest hotel transaction in the first half of 2026. The sale is a development exit by a Japanese developer, contractor and Thai operator consortium to a Japanese institutional real estate manager, with Centara retained as operator. This differs from the REIT acquisitions of 2025 and the business hotel trades that dominate Osaka’s count. No repositioning plan has been disclosed.

2. The Ritz Carlton Perth (Perth, Australia), USD 201m
The Generation Essentials Group acquired The Ritz- Carlton Perth from Far East Consortium International for approximately USD 201 million in May 2026. It was the largest hotel transaction in Australia in the first half of 2026 and one of the highest per-room prices ever recorded in the country.
The hotel forms part of the Elizabeth Quay precinct and opened in 2019. The seller is a Hong Kong-listed developer that built the hotel as part of a mixed-use scheme. The buyer’s plans have not been disclosed. The hotel continues under the Ritz-Carlton brand.

3. InterContinental Auckland (Auckland, New Zealand), USD 103m
Hotel Properties Limited (HPL) acquired the InterContinental Auckland from Precinct Properties for approximately USD 103 million in January 2026. The hotel opened in 2024 as part of the One Queen Street redevelopment on Auckland’s waterfront and is the largest hotel transaction in New Zealand in our dataset.
New Zealand sits within ‘other markets’ in the market tables. The buyer is a Singapore-listed owner and operator with a portfolio across the Asia Pacific. The seller is a New Zealand-listed office landlord exiting a non-core hotel component. The hotel continues under the InterContinental brand. No repositioning plan has been disclosed.
The Four Forces in Asia Pacific
Four forces determine where the hotel investment goes in Asia Pacific: money, governments, travellers and supply. The first three shaped 2025 and the fourth will shape the years that follow.
Money
2025 was the last year of cheap borrowing in most of the region. In 2026 that ended, and it ended everywhere at once. The war in the Middle East sent oil prices sharply higher, and because Asia imports most of its energy, the cost of fuel, freight and imports rose across the region within weeks. Inflation followed, and central banks that had spent 2025 cutting rates began raising them. For the first time since we started this series, every large market was tightening at the same time.
The hotel market did not slow down as much as that might suggest. What changed was who was buying. Investors who needed bank debt to make a deal work stepped back. Investors who could pay with their own money kept going: Japanese REITs, family offices and institutions looking for steady income. Cheap money is no longer what drives hotel investment in Asia Pacific. Deep pools of domestic capital are, and Japan has the deepest.
Governments
In 2025 governments moved travellers more than prices did. A visa decision can redirect millions of trips in a matter of months, and this year several did. China and South Korea made entry easier and both set arrival records. Then China told its citizens not to travel to Japan, and Chinese visits to Japan fell by more than half. That was the largest single shock to demand in the period. What is telling is how little it reached the hotel investment market. Japan kept closing deals at the same pace, because the buyers were domestic, the hotels they bought were full of Japanese, Korean and Taiwanese guests, and none of them had underwritten their purchase on Chinese demand.
A market that can lose its biggest source of visitors and not miss a deal is a market whose investment case rests on many legs rather than one. Planning rules turned out to matter as much as visa rules. When Hong Kong allowed hotels to be converted into student housing, a new kind of buyer appeared almost at once, and the price of a mid market hotel in Kowloon began to be set by what a student bed is worth rather than what a room night is worth.
Travellers
People kept travelling, and they spent more per trip. Japan, Korea and Hong Kong set records for arrivals. Japan, China, Singapore and Australia set records for spending. Asia Pacific is still the only major region below its 2019 level, but the gap is closing. What is running out is room to raise prices. Hotels increased rates for a third year in a row, and by mid 2026 those increases had slowed to almost nothing, because guests had reached the limit of what they would pay and, in cities like Shanghai and Chengdu, because new hotels were opening faster than visitors arrived.
From here, growth depends on filling more rooms rather than charging more for them. That, in turn, depends on airline seats, the price of fuel and whether Chinese travelers come back. The year was when buying an existing hotel was better than building a new one, and converting a cheap one was even better. Shows why the 2025 segment shift is a story about construction costs and planning rules rather than guest preferences.
Scarcity, optionality and investability
The fourth force is supply. Travellers determine where hotel revenues can grow, but the ability of supply to respond increasingly determines where that growth becomes investment value. The eight markets in this report are moving in different directions. These differences produce a useful distinction for investors. Japan, South Korea, Singapore and parts of Australia are scarcity markets. Hong Kong is an optionality market. China and Thailand are becoming selection markets. India is a growth market. The same increase in tourism demand has a different value depending on which of those markets receives it. That distinction matters more as financing becomes expensive.
When debt is cheap, rising asset values can compensate for mistakes in supply assumptions. When borrowing costs rise, the hotel itself has to do more of the work. Investors need operating income, barriers to new competition, an alternative use, or enough demand growth to absorb additional supply. The next phase of Asia Pacific hotel investment will therefore be less about where tourism grows fastest and more about where demand growth meets scarce supply, flexible real estate and capital that can hold through a more expensive financing cycle.
IN 2025, THE ARGUMENT WAS TO BUY RATHER THAN BUILD.
The next question is more selective:
Where can supply not easily follow demand?
The case for active ownership
There is one final conclusion from the eight markets in this report: owning the right hotel is no longer enough. Higher financing costs, shifting government policy, changing travel patterns and uneven supply are making hotel investment more complex. Value now depends not only on choosing the right market or asset, but on how effectively that asset is positioned and managed. This changes the role of the owner.
In a rising market, owners can benefit from forces outside their control. Occupancy grows, ADR follows, and asset values rise. In the environment emerging across the Asia Pacific, returns will increasingly have to be created at the asset level. That means challenging budgets, benchmarking performance, optimising revenue strategy, scrutinising costs, controlling capital expenditure, evaluating the operator and brand, and continuously testing whether the property's current positioning remains its highest-value use.
The eight markets illustrate why. An owner in Japan must protect margins while labour and financing costs rise. In China, the challenge is distinguishing genuine recovery from performance temporarily diluted by new supply. In South Korea, strong demand must be converted into rate and profitability. Australian owners need to maximise the value of increasingly scarce existing stock. In Singapore, where assets are expensive and opportunities are limited, small improvements in operating performance can have significant consequences for value. Indian investors must manage rapid growth, new supply and institutionalisation. In Thailand, owners need to defend market share as new upscale and luxury supply enters.
None of these decisions sits neatly within traditional hotel operations. An operator's principal responsibility is to operate the hotel and protect the brand.
The investor's objective is broader: to maximise the return and value of the underlying asset throughout the ownership cycle. Those objectives frequently overlap, but they are not identical. That gap is where professional independent asset management becomes more and more important.
The asset manager represents the owner's capital while working with the operator to improve the hotel. Independence matters because decisions about budgets, CapEx, contracts, branding, repositioning, financing and ultimately disposal should be assessed against the owner's investment objectives rather than those of any particular operator, brand or service provider. Professionalism matters because the decisions are becoming too complex, in operating, financial and real estate terms, to treat asset management as periodic oversight.
The evidence from 2025 and the first half of 2026, therefore, points to a broader evolution in Asia Pacific hotel investment. The previous cycle rewarded access to capital. The recovery rewarded access to travellers. The next cycle is likely to reward active ownership.
For hotel investors, that means moving from monitoring performance to actively creating it. At Global Asset Solutions, this is the principle behind independent hotel asset management: work for the hotel, represent the owner's interests and collaborate with operators and brands to maximise the long-term performance and value of the asset
Because when money is more expensive, governments can redirect demand, travellers are more selective and supply behaves differently in every market, the difference between owning a hotel and managing a hotel investment becomes gradually more important.
Authors:

Alex Sogno
Chief Executive Officer

Leanne Reddie
Chief Commercial Officer

Robert Walters
Chief Investment Officer

Douglas Louden
Managing Partner

Juan Manuel Gea
Chief of Staff


